HomeAway
Optics: A Real-time Data Analytics Solution
2024-9-24
Shubham Pandey
Expedia Group Technology — Innovation
Enabling performant and lightweight real-time analytics

The Data Platform & Products team at Expedia Group™️ has crafted a framework and analytics tool designed to provide users with real-time (<15 seconds) data. This innovative solution enables users to extract meaningful insights, optimize daily operations, and enhance team performance.
By: Shubham Pandey, Matthew Sessions, Eric Kerstens, Andrew Johnson, Ankush Asthana
Introduction
At Expedia Group, our commitment to providing exceptional service to Travelers and seamlessly managing relationships with Travel Partners is a cornerstone of our success in the Travel industry. As a global travel company, our service partners operate worldwide, delivering world-class service to travelers and partners around the clock.
Diverse interactions with travelers and partners generate extensive data; surfacing real-time, curated access to this data is crucial for unlocking its true potential and driving successful business decisions. Essential tools for daily operations and team management are vital for service partners, enabling prompt responses, improving performance and ensuring compliance. The evident benefits of real-time analytics in the service industry are indispensable for staying ahead in a time of growing demand for world-class service.
Effectively capturing, processing and presenting real-time data to users poses a significant challenge in establishing a reliable and scalable analytic solution. Traditional approaches involving ingesting raw data through event-based systems like Kafka, followed by analytics on warehouse data, are time-consuming. Despite advancements in data technologies, analyzing large volumes of data (in this scenario — ~4500 unique new events/sec equating to data size 4.5 MB/sec) in under 15 seconds remains challenging.
The challenge and solution
The key to this problem was two-fold:
- Being able to curate the data in event form before it gets warehoused.
- Being able to query this data through a web-based browser UI with blazing-fast speeds.
Addressing the initial challenge, we underwent several iterations utilizing the most advanced tools and technologies within the industry. Our initial approach, successful for a notably lighter workload, involved employing Python-based microservices to handle data from event streams. These microservices processed the data before ingesting it into Snowflake for retrieval through web-based Looker reports.
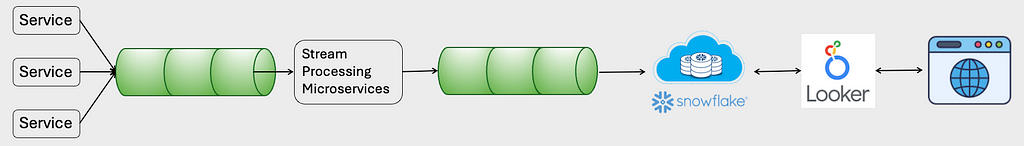
However, we soon recognized the limitations of this solution, as it proved non-scalable and cost-prohibitive. Snowflake, not optimized very well for real-time ingestion, presented scalability, latency, and cost efficiency challenges. While data ingested into Snowflake becomes readily available for querying, performance is impacted as data segmentation occurs only after a brief pause in ingestion. With continuous data streams, this issue grew exponentially over time, resulting in diminished performance of the tables. We encountered challenges supporting 100 concurrent users, with reports refreshing every minute. Under peak load conditions, the report load time degraded to over 2 minutes. To overcome these bottlenecks, we shifted our design to incorporate Apache Druid, a memory-based database.
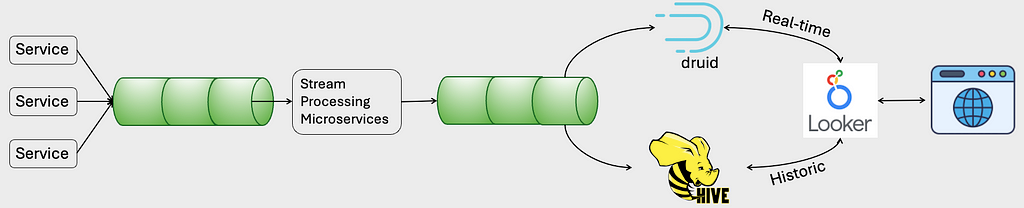
An integral feature of Druid, crucial for our real-time reporting requirements, is its robust support for real-time data ingestion from multiple source technologies. Druid excels in handling data as it flows in, ensuring that the latest information is instantly available for analysis. As a tradeoff, Druid does not offer the same level of analytic complexity as a traditional database. Consequently, much of the analytical processing needs to be carried out in our microservices, which process asynchronous data events.
Although Druid supports direct and nearly instantaneous Kafka data ingestion, it is limited to insert-only operations. Real-time Druid ingestion appends new records to uncommitted segments which are immediately query ready. This is necessary to support low-latency data retrieval, but it doesn’t provide time to execute merges and updates. This presents challenges when dealing with dynamic events, necessitating accurate querying of the relevant records for our reports. We have achieved success by fine-tuning our table structures, optimizing data ingestion processes, and tailoring queries to specific reporting use cases. While this introduces some additional engineering overhead, it has allowed us to significantly reduce costs by 30% and decrease reporting latency to within 15 seconds of the originating events from source systems.
After solving for data recency, we quickly realized that the Looker service is not designed to support the high query volume and dashboard refresh rate required to support our user base. Looker is optimized to support complex, analytic use cases, but when extended to high refresh reports, it could not maintain the number of connections needed by our users. It would lose track of outstanding queries, fail to close connections, and would frequently reach a point where our users faced degraded experiences — we’d have to restart the entire Looker service to get it working again. This led to a subpar user experience and prevented our stakeholders from obtaining up-to-date data crucial for effective business operations.
The Solution
Failing to find a suitable out-of-the-box front-end solution, we decided to build our own.
The solution comprised two key components:
- Data Resolver API;
- Web browser-based visualization layer.
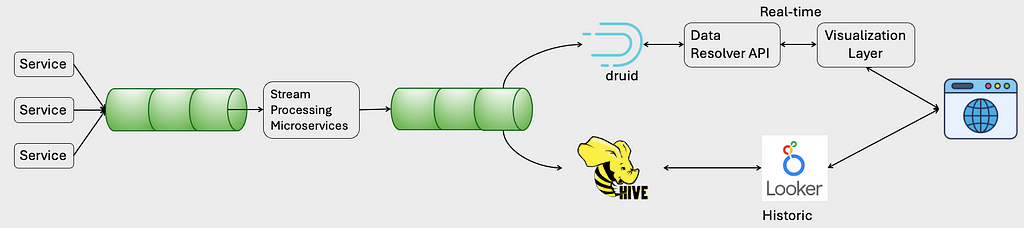
To keep this solution modular and pluggable, we designed it as a library of UI components that provides a catalog of React-based UI components that can be powered by various data sources to build visual data tiles on a webpage. The visual components created using this library can be embedded in any web-based application, thus making it a very pluggable analytic solution that can be featured on regular user-based tools as a single pane of glass.
With multiple service providers and partners using the same set of real-time analytical reports, it became crucial to correctly fence data based on which user uses the reports without adding a lot of overhead in performance on the queries. This was solved in the data resolver API, which uses a User’s profile and Role-Based Access Control only to resolve the data a User can view. Data filtering at the very top of the funnel helped us further enhance query performance and data accessibility at the presentation layer, which keeps the UI component snappy. Thus far, our solution has effectively supported over 450 concurrent users, with reports refreshing every 15 seconds. Achieving a 100% adoption rate, we have successfully onboarded more than 1,800 users. The 90th percentile response time consistently remains below 1 second, and the average response time has been under 600 milliseconds throughout the past month. With this robust solution, we confidently meet our availability SLA of 99.9% for real-time analytics.
Summary
In this blog post, we’re excited to detail our journey in developing an advanced real-time analytics framework. This framework empowers Expedia Group’s service partners worldwide by providing crucial data points, enabling them to make strategic business decisions, optimize operations, boost agent performance, and deliver exceptional service to travelers.
Compared to previous solutions, our innovative framework supports a 5x more extensive user base while reducing cloud infrastructure costs by approximately 40%. The responsiveness of the generated reports enhances accessibility and user-friendliness, ultimately elevating the overall user experience.
Our commitment to continuous improvement means always learning and refining our solutions to address emerging challenges. We trust you’ve found this post both enjoyable and insightful.
Thank you for your time, and happy problem-solving!
Learn about Life at Expedia Group
Optics: A Real-time Data Analytics Solution was originally published in Expedia Group Technology on Medium, where people are continuing the conversation by highlighting and responding to this story.