Criteo
A Perfview Alternative in WebAssembly
2024-9-24
Grégoire Verdier
TL;DR: Try using .NET Events Viewer next time you need to analyze a nettrace file.

The .NET runtime exposes a unix socket (named pipe on Windows) endpoint on which diagnostic commands can be sent to collect tracing data: the EventPipe. For example, a command can be sent to dump the memory of the process or to collect GC events.
Typically, developers won’t connect directly to this endpoint but will use tools like dotnet-counters, dotnet-gcdump, or dotnet-trace to do the job. Here’s an example of using dotnet-trace to collect lock contention events:
dotnet-trace collect --clrevents contention --clreventlevel informational --process-id <PID>
A contention event, in a human-readable format, looks like this:
Capture Thread: 395
Thread: 395
TimeStamp: 53041023
Activity: 00000000-0000-0000-0000-000000000000
Related Activity: 00000000-0000-0000-0000-000000000000
Payload:
  ContentionFlags: 0,
  ClrInstanceID: 0,
  LockID: 140376711696544,
  AssociatedObjectID: 140408520298400,
  LockOwnerThreadID: 148
Stack Trace:
    System.Threading.ManualResetEventSlim.Wait(int, System.Threading.CancellationToken)
    System.Net.Sockets.SocketAsyncContext.PerformSyncOperation(OperationQueue<T>&, T, int, int)
    System.Net.Sockets.SocketAsyncContext.ReceiveFrom(System.Memory<unsigned int8>, System.Net.Sockets.SocketFlags&, System.Memory<unsigned int8>, int&, int, int&)
    System.Net.Sockets.Socket.Receive(unsigned int8[], int, int, System.Net.Sockets.SocketFlags, System.Net.Sockets.SocketError&)
    Aerospike.Client.Connection.ReadFully(unsigned int8[], int)
    Aerospike.Client.Info.SendCommand(Aerospike.Client.Connection)
    Aerospike.Client.Node.RefreshPartitions(Aerospike.Client.Peers)
    Aerospike.Client.Cluster.Run()
These tools for collecting data through the EventPipe are user-friendly and invaluable for performance investigations. However, the tools for analyzing the collected data are not the best. dotnet-trace writes data to a file in a custom “nettrace” format, and the recommended way to read this file is with the Windows tool PerfView.
Problems with PerfView
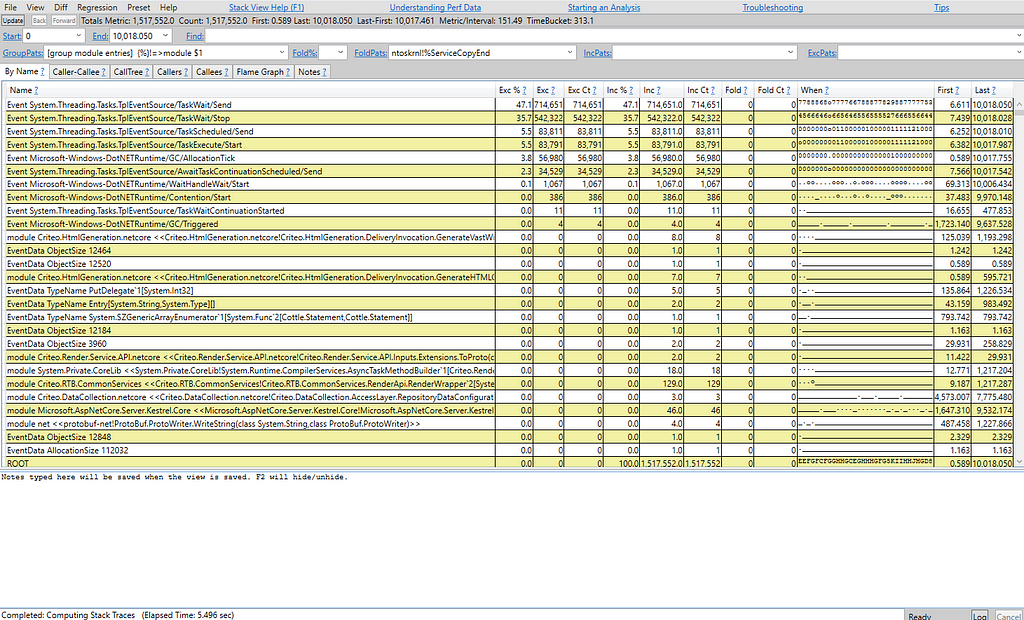
First, PerfView is far from the most user-friendly application I’ve encountered. Despite working in the performance team at Criteo and using the tool weekly for 2–3 years, I often found myself forgetting how to perform basic tasks, such as filtering events by a field value.
A colleague mentioned that these tools aren’t designed to be particularly user-friendly, as they are intended for experts in the field. However, at Criteo, our support team collaborates with hundreds of .NET developers, and we want all of them to easily conduct basic performance analyses of their services. We found that PerfView presented a significant obstacle to this goal.
Additionally, .NET has been cross-platform for over eight years. At Criteo, we transitioned our entire fleet of approximately 45,000 servers to Linux. As a result, many developers switched from Windows workstations to Linux/MacOS, losing access to the Windows-only PerfView. The dotnet-trace documentation mentions some alternatives:
For traces collected on non-Windows platforms, you can also move the trace file to a Windows machine and view it in Visual Studio or PerfView.
and
On Linux, you can view the trace by changing the output format of dotnet-trace to speedscope.
However, when I last tried converting a nettrace file to the speedscope format, it took several minutes and produced a file ten times larger. Currently, using dotnet trace convert format SpeedScope always yields an empty JSON file for me. Additionally, the SpeedScope UI doesn’t seem well-suited for visualizing .NET events, as it lacks features like aggregating threads.
Lastly, when mentoring developers on performance investigations, I noticed a reluctance to download yet another tool.
Given these challenges, I envisioned a tool that runs directly from the browser on any platform, covering the most common use cases of PerfView.
A New Modern PerfView
Blazor is a front-end framework that allows compiling your .NET code into WebAssembly to run it within the browser. This was crucial for this project, as JavaScript would have been too slow and unsuitable for parsing large nettrace files. Additionally, for security reasons, the file should be processed on the user’s machine, it should never exit your browser. Finally, it makes sense to use .NET for a .NET performance tool. Thus, Blazor was the ideal technology for this project.
Nettrace Parser
Initially, I attempted to use the PerfView library to parse nettrace files, but I quickly encountered two major issues. First, the parser doesn’t support asynchronous input, causing the UI to freeze during parsing, which can take anywhere from seconds to minutes. Second, PerfView’s nettrace parser is essentially a nettrace-to-etlx converter combined with an etlx parser. Due to these limitations, I decided to create my own parser using modern .NET features such as Span<T> and System.IO.Pipelines. You can find the code here github.com/verdie-g/dotnet-events-viewer/tree/main/EventPipe.
UI
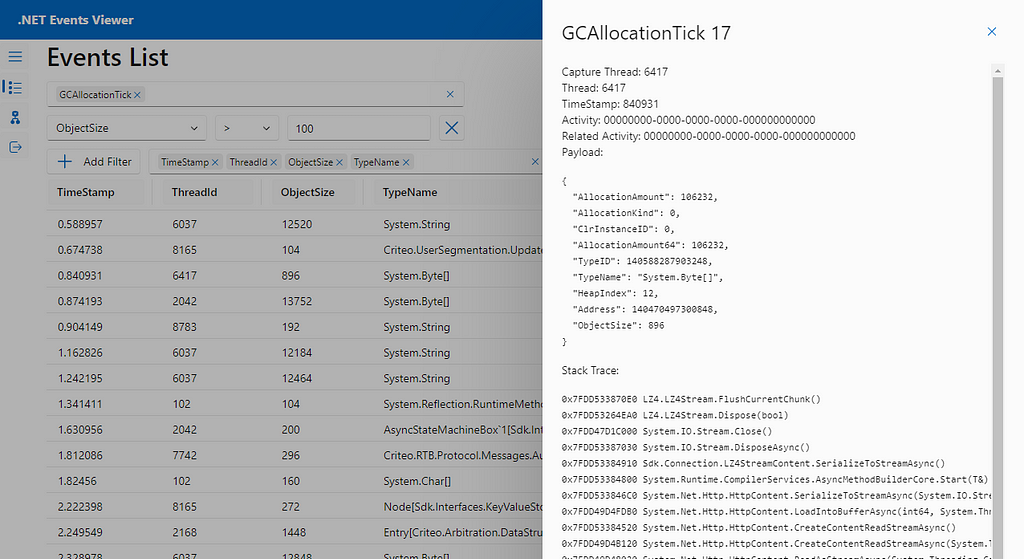
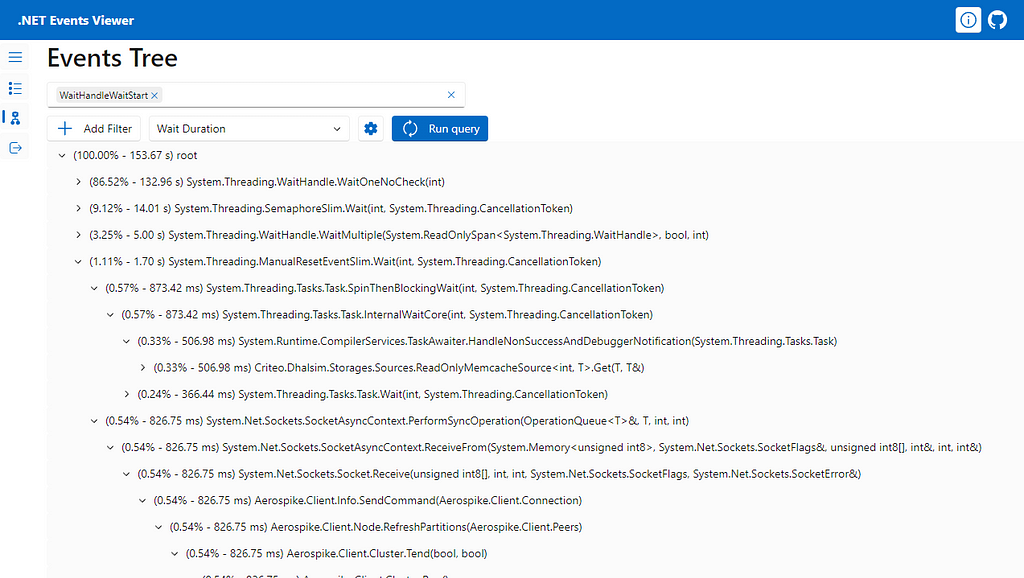
For the MVP, I wanted two pages. The first would be a simple list of all events ordered by time, allowing users to view the payload and stack trace of individual events. The second would be a tree view of the merged stack traces.
I chose Fluent UI Blazor as the component library because it’s the same library used by Aspire’s dashboard, and Microsoft is investing significant effort into this project, providing strong guarantees about the future of that UI library.
Finally, here are a few screenshots of the project that I inspiredly named .NET Events Viewer:
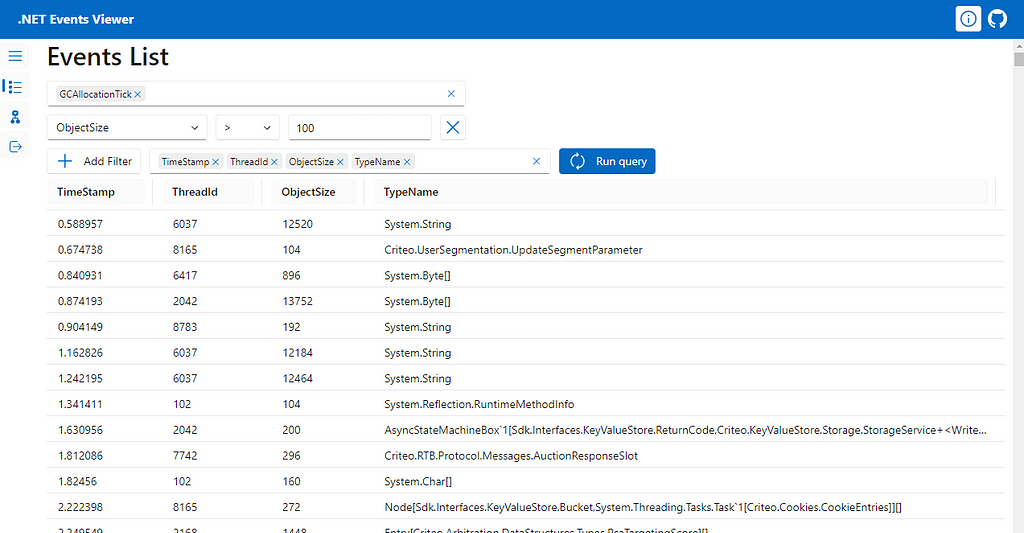
Because there is no server code, the code was simply hosted on a GitHub page: verdie-g.github.io/dotnet-events-viewer. Try it out yourself and please give it a star on github.com/verdie-g/dotnet-event-viewer if you find this project useful!
Limitations
When loading a new trace, this tool parses all events and saves them in memory, which can be twice the size of the original nettrace file. This can be problematic for large nettrace files. For instance, one of our main services allocates 2 GB/s, resulting in a 12 GB trace for a 30-minute verbose GC trace.
Additionally, I discovered late in the project that WebAssembly only supports 32-bit addressing, limiting memory usage to 4 GB. There is a proposal to support 64-bit addressing here: github.com/WebAssembly/memory64.
Moreover, there appears to be a bug in Blazor that prevents using more than 1 GB of memory (dotnet/runtime#102574).
As a result, .NET Events Viewer can only handle files smaller than 500 MB to 1 GB. Fortunately, in my experience, that is enough to cover most use cases.
Try using .NET Events Viewer next time you need to analyze a nettrace file:
A Perfview Alternative in WebAssembly was originally published in Criteo Tech Blog on Medium, where people are continuing the conversation by highlighting and responding to this story.