Swiggy
Unlocking Cost Savings: Compression in Ingestion’s ALB Optimization
2024-9-11
Sundaram Dubey
Co-Authored By Vikash Singh
Swiggy is a data-driven company, The platform that manages its data must not only be robust and scalable but also constantly evolve to meet growing demands. Continuous optimization and innovation are essential to ensure the platform delivers high performance, reliability, and efficiency. This enables Swiggy to make faster, more informed decisions while seamlessly scaling with the business.
Overview of Ingestion
Before diving into the specifics of this blog, let’s first provide a quick overview of Swiggy’s event-ingestion service.

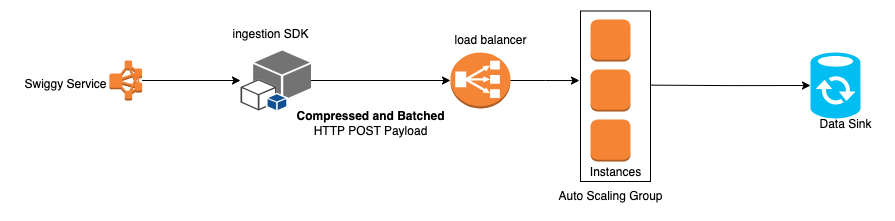
Any Swiggy service can interact with our event ingestion API or integrate with the ingestion SDK to seamlessly send data for processing. The HTTP request body carries the event, which is ingested into the data sink in real-time. This real-time data is then available for a variety of use cases, including analytics, machine learning models and features, debugging, historical analysis, and business decision-making.
The Cost Bump
At one of our recent cost review meetings, we stumbled upon something quite surprising — on one of our highest traffic days, our ALB (Application Load Balancer) costs exceeded our EC2 (Elastic Compute Cloud) costs. Sounds alarming, right? It caught our attention.
Over a 15-day period, we observed that our ALB costs were almost 28% higher than our EC2 costs. Given that EC2 typically accounts for the majority of infrastructure spending in high-scale environments, this was a wake-up call.
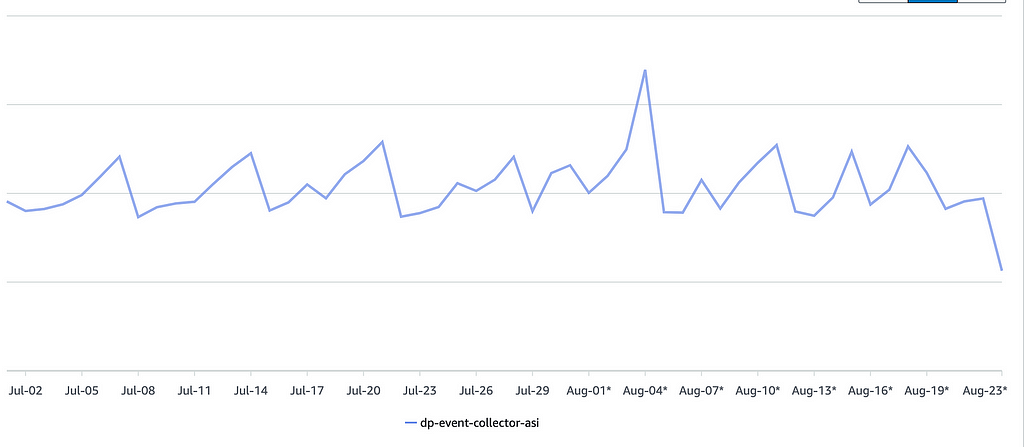
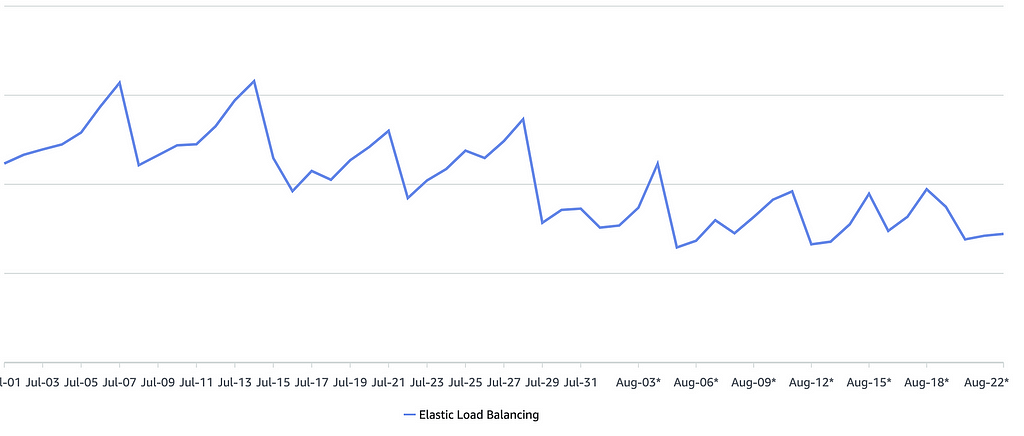
Below are images of the cost of ASG and ELB respectively.
At some point Percentage diff: ((512–400) / 400) * 100 % = 28%

ALBs are essential for routing traffic efficiently across our microservices architecture, but when the load balancer cost is outpacing the compute cost, it’s a clear sign that there’s room for optimization. So we decided to dive in and figure out why this was happening — and more importantly, what we could do to bring these costs under control.
Root Cause Analysis
To understand the root cause of our unexpected ALB cost surge, we first needed to get a handle on the factors driving these costs. ALB pricing is based on something called Load Balancer Capacity Units (LCU), which essentially quantifies the amount of work the load balancer is doing.
But what exactly impacts LCU? And how did we end up with such high LCU usage?
An LCU measures the dimensions on which the Application Load Balancer processes your traffic (averaged over an hour). The four dimensions measured are:
- New Connections: Number of newly established connections per second. Typically, many requests are sent per connection.
- Active Connections: Number of active connections per minute.
- Processed bytes: The number of bytes processed by the load balancer in GBs for HTTP(S) requests and responses.
- Rule Evaluations: The product of the number of rules processed by your load balancer and the request rate. The first 10 processed rules are free (Rule evaluations = Request rate * (Number of rules processed — 10 free rules).
With these factors in mind, we started examining our traffic patterns and configuration. How were we handling incoming traffic? Was there an unusually high number of new or active connections? Were we receiving large payloads or inefficient routing rules? These were the questions we needed to answer to explain our high LCU count.
In the following sections, we’ll walk through the key areas we investigated to get to the bottom of our ALB cost spike and the strategies we implemented to optimize our LCU usage.
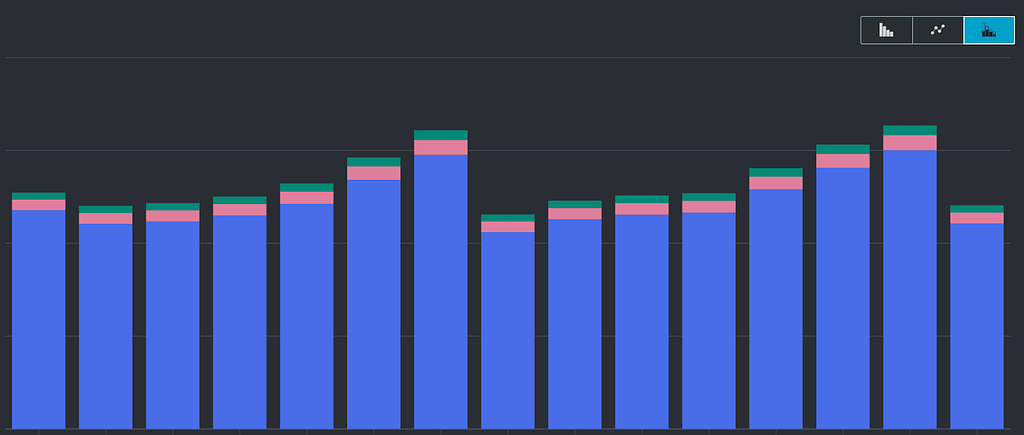
After analyzing the different aspects affecting our ALB’s cost, we turned to AWS CloudWatch metrics to dig deeper. What we discovered was quite revealing — the processed bytes metric was off the charts compared to the other factors influencing the LCU cost.
AWS ALB pricing, as we mentioned earlier, is based on four key components: new connections, active connections, processed bytes, and rule evaluations. When we visualized these metrics in CloudWatch, the processed bytes completely dominated the graph, with the lines for new connections, active connections, and rule evaluations barely noticeable. However, by optimizing new connections by batching multiple HTTP events together in our ingestion-SDK, we were able to significantly reduce the new connection overhead (how batching is done, we will see in later parts), even though processed bytes remained the largest contributor to costs.


From 29th July onwards you can see processed bytes are nearly half. In the below section, we will explain how we did that.
A Simple Solution
Given that our service processes data in real-time, latency was a key factor we had to consider while optimizing costs. After brainstorming, we landed on a solution: compress the incoming request payloads before reaching ALB.
This seemed like a clear win — compressing each request would reduce the payload size and, in turn, reduce the processed bytes contributing to our ALB cost. However, there was still one challenge: while compressing individual requests helped, we were still making HTTP calls for each request, which limited the potential compression benefit. The next big question was, how do we maximize the gains from compression?
Batch Compression to the Rescue
To further enhance the benefits, we decided to compress requests in batches. Here’s how we approached it:
- SDK Modification: We updated our internal SDK (a library that other services integrate with to send requests to our main service) to enable compression on batches. This would allow us to send multiple requests in one compressed payload rather than making individual HTTP calls for each.
Below are the relevant Go code snippets for this update:
Snappy Compression
func SnappyCompress(data []byte) ([]byte, error) {
 output := new(bytes.Buffer)
 writer := snappy.NewBufferedWriter(output)
 if _, err := writer.Write(data); err != nil {
 return nil, err
 }
 // close the snappy writer to ensure compressed data is copied to output
 if err := writer.Close(); err != nil {
 log.Print(context.Background(), "failed to close snappy writer", "err", err)
 return nil, err
 }
 return output.Bytes(), nil
}
Make Compressed Request Body
func (sender *httpSender) makeRequestBody(data []byte) ([]byte, bool) {
 switch sender.CompressionType {
 case SnappyCompression:
 compressedData, err := snappy.SnappyCompress(data)
 if compressedData != nil && err == nil {
 return compressedData, true
 } else {
 log.Printf("Error in compressing data using Snappy: %v, proceeding to send uncompressed data as request body", err)
 }
 default:
 return data, false
 }
 return data, false
}
HTTP Post Request
func (sender *httpSender) post(url string, body interface{}, appName string) (*MessageResponse, error, bool) {
 data, err := json.Marshal(body)
 if err != nil {
 log.Printf("Error in Marshalling data %+v %+v", body, err)
 return nil, err, false
 }

 finalData, compressionSucceeded := sender.makeRequestBody(data)
 req, err := http.NewRequest("POST", url, bytes.NewReader(finalData))
 // erorr handling and rest of code..
}
Batched Events HTTP Request
func (sender *httpSender) SendBatch(events []*Event) (*MessageResponse, error, bool) {
 return sender.post(sender.batchUrl, events, events[0].Header.AppName)
}
2. Metrics for Visibility: We introduced Prometheus metrics to track the compression efficiency in real time. This gave us insights into how much we were saving on payload size and allowed us to measure the impact of batch compression over time.
The Compression Results Were
…Impressive, as we expected it to be. We observed ~60–70% compression of the payload size when comparing compressed versus uncompressed data. This reduction directly contributed to lowering our ALB costs. Also, we didn’t see any latency increase in our usual batch sizes, as we chose Snappy after benchmarking.

Compressed vs. decompressed payload size
Why Snappy Compression?
We chose Snappy as the default compression algorithm over gzip. Why Snappy? We are not covering gzip vs snappy in detail in this blog, that will be a different topic but here are a few points for our choice of snappy over gzip:
Speed: Snappy is optimized for both fast compression and decompression, which is critical when dealing with real-time data where latency matters.
Efficiency: While gzip provides a higher compression ratio, Snappy offers an optimal balance between speed and compression, making it ideal for our high-throughput, low-latency environment.
CPU Utilization:
- Snappy is much more CPU-efficient than gzip. Gzip, while offering better compression ratios, consumes significantly more CPU power to perform compression and decompression tasks.
- Our system operates at scale, and compressing millions of requests per minute means that every percentage point of CPU usage matters. By using Snappy, we kept CPU usage low while still gaining substantial cost savings from reduced payload sizes. In contrast, GZIP would have spiked CPU utilization, leading to higher infrastructure costs and possibly even impacting the performance of our real-time service.
The modified event-ingestion flow:
EC2 cost view After implementing decompression
We can’t overlook this factor while implementing decompression on the ingestion end. By leveraging Snappy, we struck the perfect balance between performance and cost-efficiency. Snappy allowed us to compress and decompress data seamlessly without negatively impacting the speed of our service. After implementing decompression on the ingestion side, we observed only a minor CPU spike of around ~1–2% on our EC2 instances. This minimal impact on processing power meant that our EC2 costs remained largely unchanged, while we achieved substantial savings on ALB costs. Here is our EC2 cost view (considering data constantly increasing in Swiggy), the cost remains the same before and after decompression implementation:
Fruits of our work
After implementing the compression strategy and integrating our SDK with a few of our top clients, it was time to measure the impact on costs. The results were promising: our ALB costs dropped by ~30%
Currently, our ALB costs are approximately 25% lower than our EC2 costs, even as the volume of data continues to grow alongside Swiggy’s rapid expansion. This was a complete turnaround from the initial scenario where ALB costs were surpassing EC2 by a significant margin. By targeting the biggest cost drivers — processed bytes — and applying compression, we were able to achieve substantial savings while maintaining performance and scalability.
Next steps
Wider SDK Rollout:
- We plan to gradually roll out the SDK compression feature to more clients across various services. This will help us further reduce ALB costs
Further Optimize Compression:
- Investigate opportunities for further optimizations, such as adjusting batch sizes for different traffic patterns and latency requirements of client service.
Spreading learning across the org
- Share the results internally in the organization to highlight the importance of continuous cost optimization and monitoring.
- Encourage other teams to review their service interactions with ALB for similar optimization opportunities.
gRPC for event ingestion
- We plan to move event-ingestion to grpc+protobuf completely.
- Using gRPC for event ingestion offers several advantages over traditional HTTP with JSON data approaches, particularly in terms of performance, scalability, and ease of use.
Acknowledgments
Thanks to Vikash Singh, Shri Nath Agarwal, Bhupendra Chawla, and the Ingestion team for your involvement in this optimization.
References
Unlocking Cost Savings: Compression in Ingestion’s ALB Optimization was originally published in Swiggy Bytes — Tech Blog on Medium, where people are continuing the conversation by highlighting and responding to this story.